Tutorial: test and measure your game locally
Preview tools Works for Godot, Unity and Bevy About 10 minutes
Before you publish, run your game on your own computer and see how it really performs. One command opens your game with a live speed counter and a performance page next to it. Everything stays on your computer: nothing is uploaded, and none of it ends up in the game you publish.
What you need
| You need | Why |
|---|---|
A browser version of your game (the folder named in build.dir) |
That is what gets tested |
The vapour command with test |
It is in preview: not in a release yet |
| A Chromium-based browser (Chromium, Chrome, Brave or Edge) | The performance page needs one. Firefox is not used |
Linux and the vapour-profiler program |
For the performance page. On other systems you still get the speed counter |
Tell the command where vapour-profiler is by putting it next to the vapour program, adding it to your PATH, or passing
--profiler /path/to/vapour-profiler.
Run it
cd my-game          # the folder with vapour.toml
vapour test
Testing TPS Demo v0.1.0 at http://127.0.0.1:41873/
FPS overlay on (local test only). Close the game tab for a summary; Ctrl+C to stop.
eBPF profiler attached to the game browser (CPU and memory, browser plus its processes).
Capture started automatically; open the profiler tab to watch it. The profiler session lasts 5 minutes. Close the browser to stop.
A browser window opens with two tabs: your game, and the performance page. Measuring has already started. To stop, close the browser or press Ctrl+C. Everything is cleaned up.
If the performance page cannot start, the command says why and carries on with just the speed counter:
Profiler not started: vapour-profiler not found: pass --profiler /path/to/vapour-profiler, set VAPOUR_PROFILER, put it next to the vapour binary, or put it on PATH
Continuing with the FPS overlay only.
Options
| Option | What it does |
|---|---|
--dir DIR |
The game folder that has vapour.toml. Default: the current folder |
--port N |
The port for your game on this computer. Default: any free port |
--no-telemetry |
Do not show the speed counter |
--no-profile |
Do not open the performance page |
--no-open |
Do not open a browser. This also skips the performance page |
--profiler PATH |
Where vapour-profiler is |
The speed counter
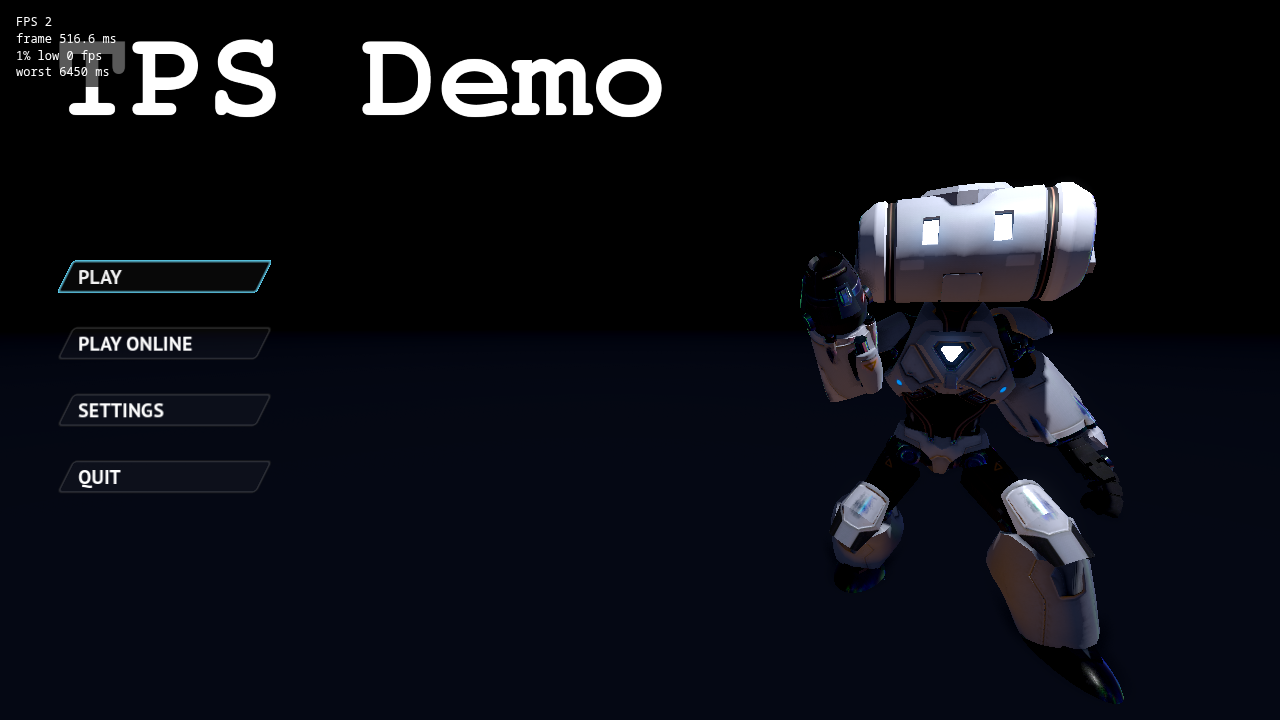
Captured in a browser without a graphics card, so the numbers are low. On a real computer they will be much higher.
The four lines mean:
| Line | Meaning |
|---|---|
FPS |
Pictures drawn per second, over the last half second |
frame |
How long the latest picture took, in milliseconds |
1% low |
How fast your worst moments were: the slowest 1% of recent frames, shown as FPS. Shows 0 until 20 frames have been drawn |
worst |
The longest single frame since the page loaded |
The 1% low is the number players feel. A game can average 60 FPS and still stutter, and a low 1% low is how you spot it. Here is a real example, the Bevy sample game just after pressing Play:
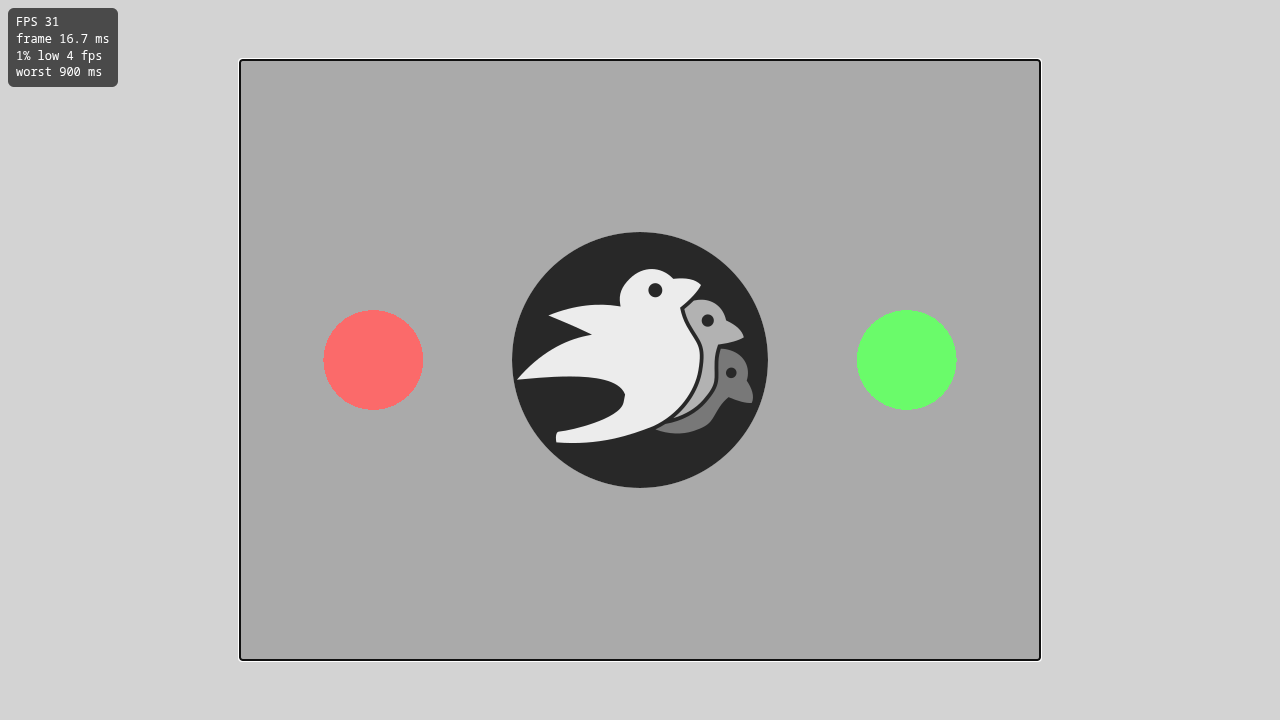
The average looks fine at 31 FPS, but the 1% low of 4 FPS and the 900 ms worst frame reveal a hitch while the game starts. The average hid it.
Press Ctrl+Shift+F to hide or show the counter. When you close the game tab, the command prints a one-line summary with the frame count, the average FPS, the 1% low and the worst frame.
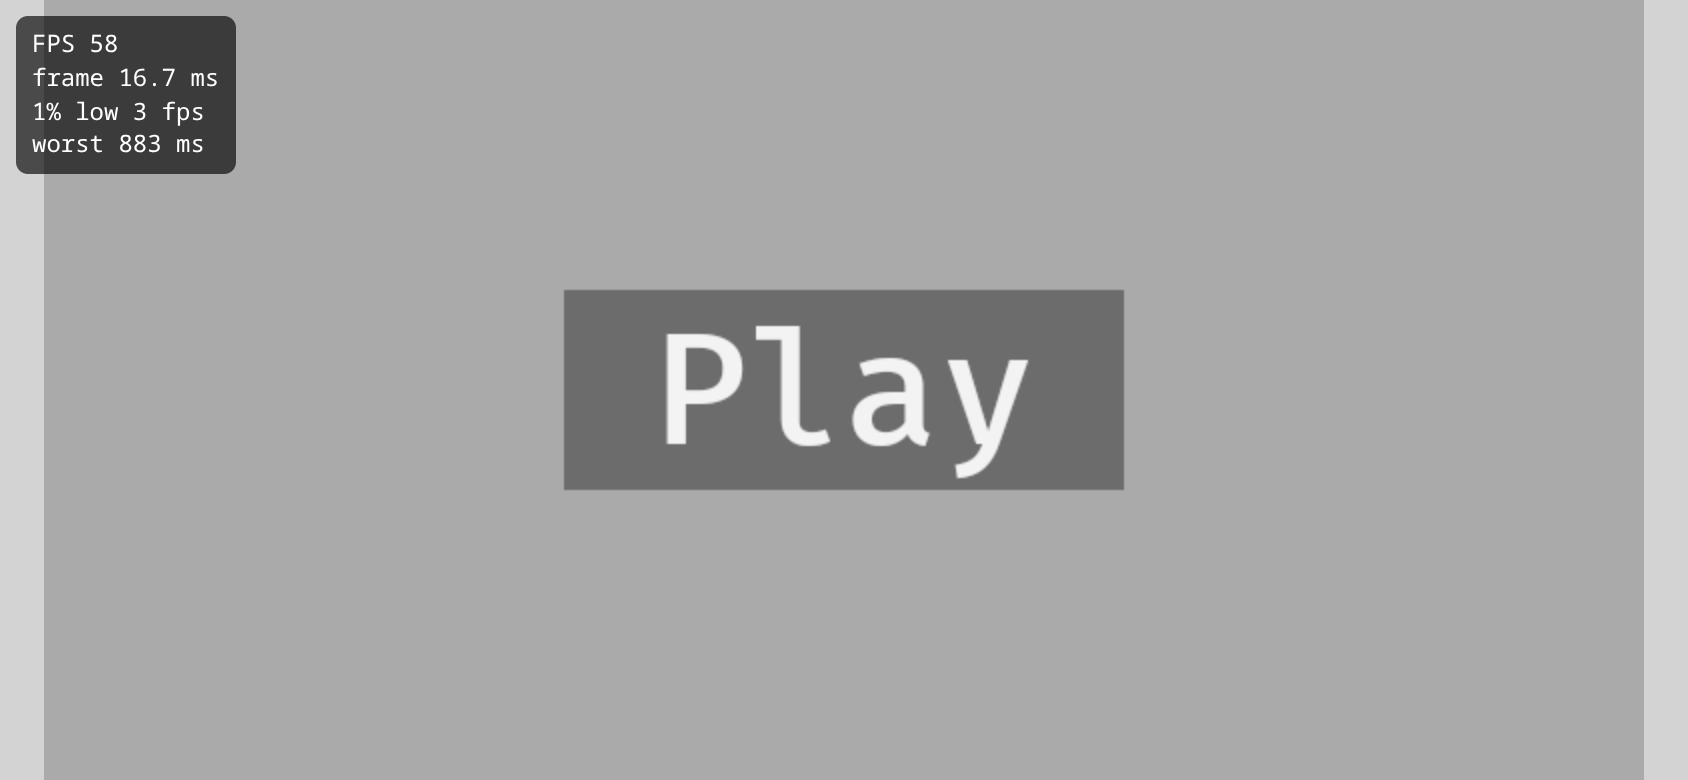
You can also test at phone size. This is the same game in a phone-sized window:
The performance page
The second tab shows how hard your computer is working while the game runs: processor, memory, and more.
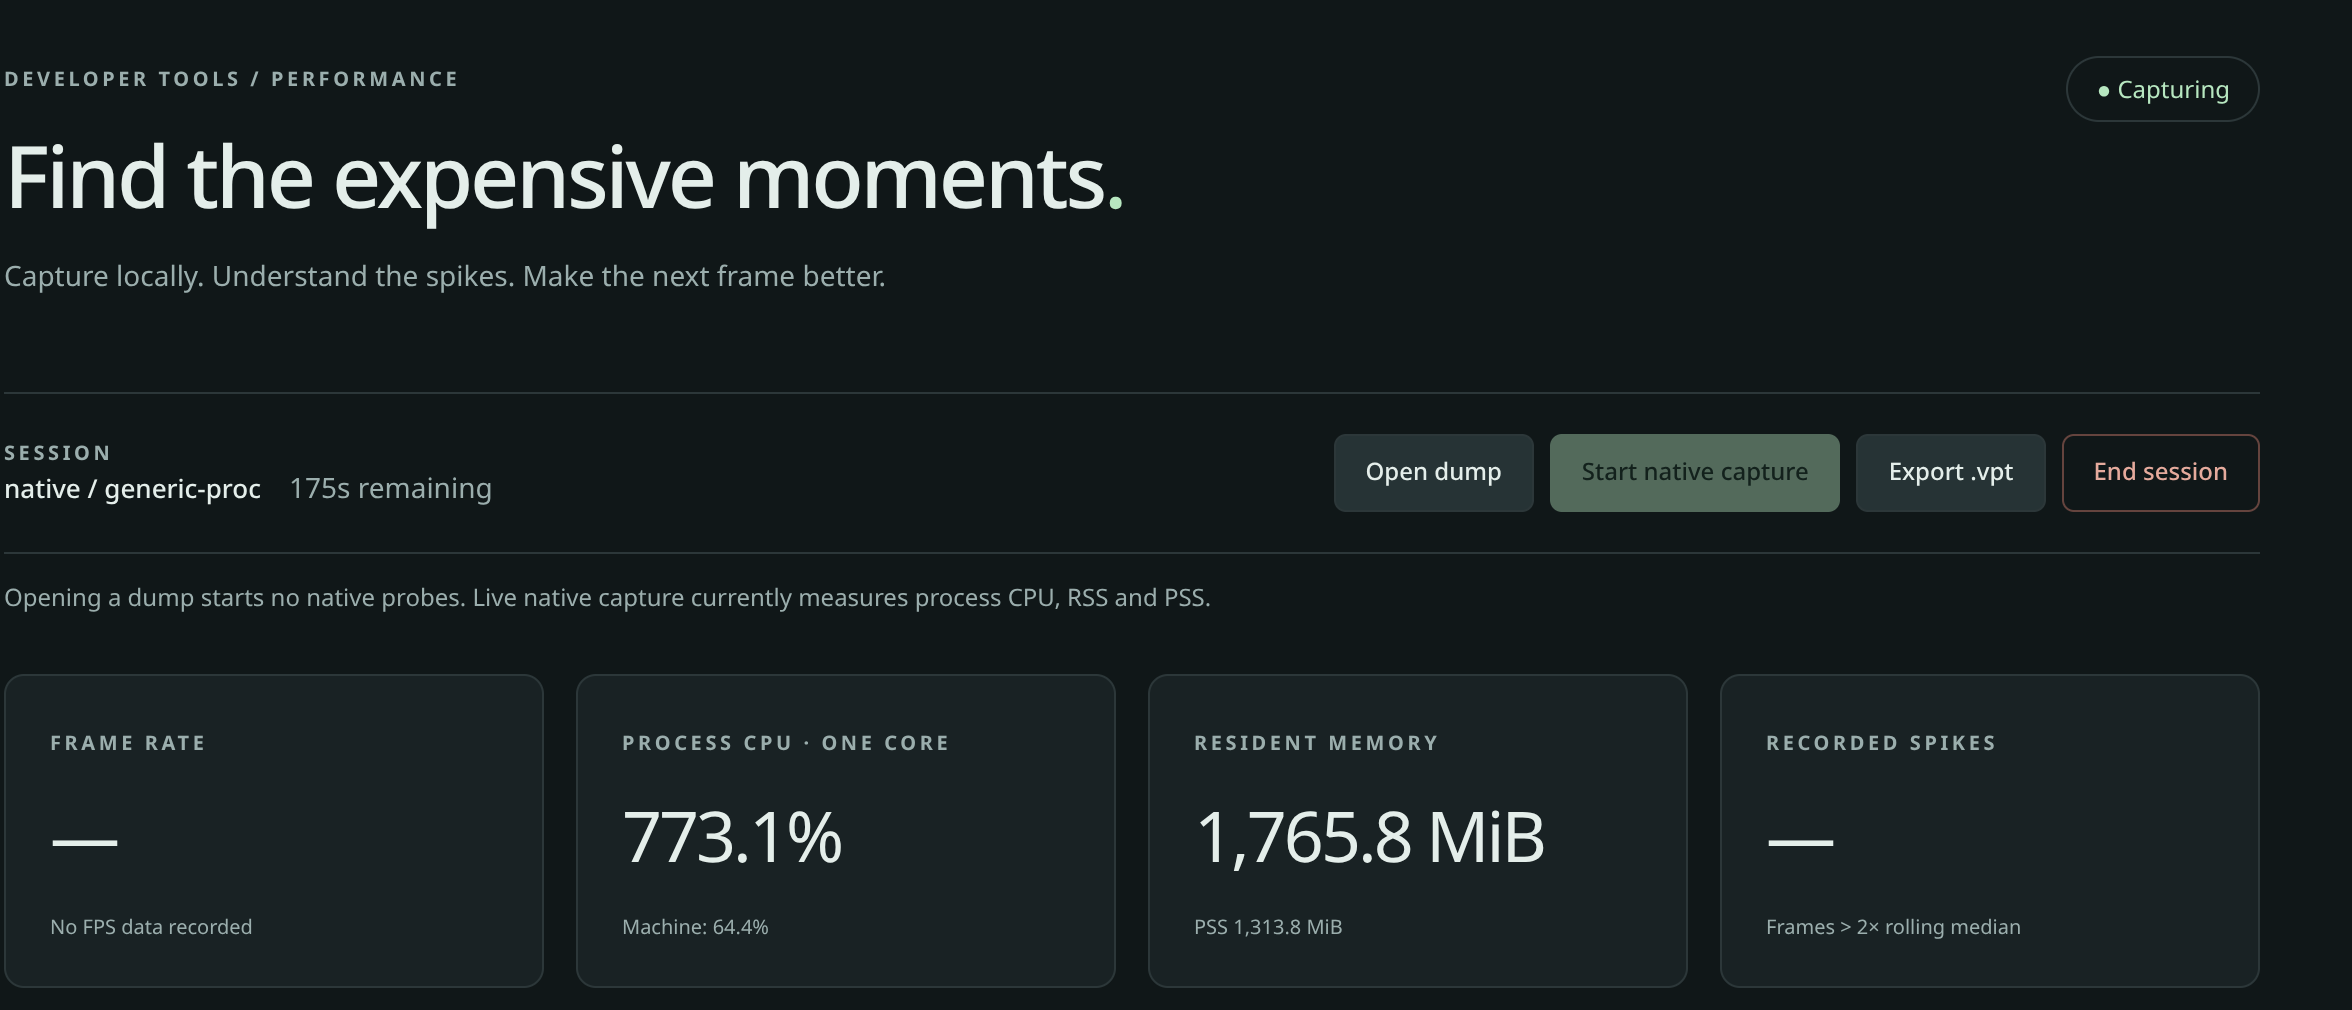
A real live test of the Godot sample game, in a browser without a graphics card.
Understand your game's performance walks through every part of the page, what each number means and what to do about it. A live test shows processor and memory. It does not show frame rate or which part of your code is slow yet; use the speed counter for frame rate.
A test lasts at most five minutes. Run vapour test again for another.
Look at a saved recording
You can open a saved recording (a .vpt file) with Open dump on the performance page. Nothing is measured when you do, it is only
read. Try the demo recording (made-up data) to see charts, a flamegraph and a report without
needing a game.
If it does not work
| You see | Do this |
|---|---|
Profiler not started: vapour-profiler not found … |
Put the program next to vapour, or pass --profiler |
no Chromium-family browser found |
Install Chromium or Chrome |
profiler did not print a dashboard URL (is port 6767 already in use?) |
Another performance page is open. Close it first |
browser exited immediately |
Try starting the browser by hand to see its message |
| FPS is only 2 or 3 | Your browser has no graphics card to use, for example in a virtual machine. The counter is telling the truth |
Nothing opens with --no-open |
That is expected. Open the address it printed |
What you learned
vapour testis local only and never changes your game.- The speed counter tells you whether your game is smooth. The performance page tells you where the computer's time goes.
- Watch the 1% low, not the average, to find stutter.